
For three years the only question at a Federal Reserve meeting was how fast the committee would cut. On Wednesday afternoon the answer went the other direction. The FOMC raised its target range for the federal funds rate by a quarter point, to 3.75 percent to 4.00 percent, the first increase since July 2023, and it did so without a single dissent.
Gold did not do what the textbook says it should have done. It went up.
That small contradiction is worth sitting with, because it is the most useful thing a metals holder can take away from this week. The relationship between rate hikes and gold is real, but it is slower, looser, and more dependent on what else is happening than the usual one-line explanation allows.
What the Fed actually did
Chair Kevin Warsh framed the move as unfinished business rather than a surprise. “The plain fact is that inflation is too high and has been for too long,” he said at the press conference. On the committee’s standard for holding steady, he was blunt: “We must be confident that underlying inflation is moving to our objective, clearly and at sufficient speed. Today, the FOMC decided that this standard has not been satisfied.”
Headline inflation has been running near 3.4 percent year over year, pushed along by an energy shock tied to the conflict with Iran. Brent crude settled at $108.75 a barrel on Tuesday. Warsh was careful to describe the labor market as steady rather than hot, noting that “job gains have kept pace with the workforce, and the unemployment rate has changed little.”
The projections that came with the decision matter more than the quarter point itself. Twelve of the eighteen participants put the appropriate 2026 policy rate at an average of 4.125 percent, which implies one more hike before the year is out. Four saw room for fifty basis points more. Two thought the committee was already done. Futures markets had priced roughly a 90 percent chance of this hike going in, so the decision itself was not news. The dot plot was.
What a Fed rate hike means for gold
The standard argument runs like this. Gold pays no interest, so when Treasuries and savings accounts pay more, the opportunity cost of holding an ounce rises and money leaves. Higher rates also tend to lift the dollar, which makes gold more expensive for buyers paying in other currencies. Both mechanisms are genuine, and both showed up in the run-up to this meeting: gold settled at $4,291.60 on Tuesday, down about half a percent, with silver at $63.236, as hike odds firmed and the ten-year yield pressed toward 5 percent.
What the standard argument leaves out is that markets move on expectations, not announcements. By the time a hike is 90 percent priced, the selling has already happened. That is most of the reason gold traded back above $4,300 and touched roughly $4,340 on Wednesday, up more than a percent from the prior settle, while silver recovered toward $64.50. The ten-year yield fell back below 5 percent after the statement landed, which took some pressure off the metal from the direction that matters most.
Understanding what a Fed rate hike means for gold therefore has less to do with the nominal policy rate and more to do with the gap between that rate and inflation. If the Fed raises to 4 percent while inflation sits at 3.4 percent, the inflation-adjusted return on cash is barely positive. Gold competes against the real interest rate, not the headline one, and by that measure this hike changed very little.
What history says about gold after a first hike
There have been ten Fed tightening cycles since 1972. Looking at gold’s performance from the first hike of each one gives a picture that surprises most people who expect a clean inverse relationship.
One month out, gold averaged a decline of 0.7 percent and finished higher in only four of the ten cycles. That is the textbook effect, and it is brief. Three months out the average return turns positive at about 5 percent, with gains in seven of ten. Six months out the average advance is 6.6 percent. Twelve months after the first hike, gold averaged a gain of 6.1 percent, with a median of 8.1 percent, and finished higher in seven of ten cycles.
The individual cycles vary enormously, which is the honest caveat. Gold rose 35.8 percent in the year after the February 1972 hike and 27.2 percent after January 1977, when inflation was the dominant story. It fell 37.6 percent after July 1980 and 11.3 percent after March 1983, when Paul Volcker was breaking inflation with rates high enough to cause a recession. The modern cycles cluster in a narrower band: up 8.0 percent after June 2004, up 8.3 percent after December 2015, and up 2.4 percent after March 2022, a year that included the most aggressive tightening in four decades.
Averages across ten observations with that much spread are context, not a forecast. What they do establish is that “the Fed is hiking, so gold falls” has not been a reliable description of the past half century. Anyone asking what a Fed rate hike means for gold over a holding period measured in years is asking a question the first month of price action cannot answer.
Why this cycle has an unusual shape
Most tightening cycles begin with gold somewhere near the middle of its range. This one begins after a violent round trip. Gold set an all-time high of $5,589.38 an ounce on January 28 of this year and now trades roughly 22 percent below that peak. A buyer who came in during the January enthusiasm is sitting on a very different experience than someone who bought two years ago.
The inflation the Fed is responding to is also partly an oil shock rather than a pure demand story, which cuts both ways. Supply-driven inflation is harder for rate increases to fix, and the geopolitical disruption behind it is the kind of condition that has historically supported gold. Warsh’s own framing will be read closely in the weeks ahead for whether this is the start of a sustained tightening campaign or insurance against an energy spike. Those two readings point at different terminal rates, and gold cares about the terminal rate far more than about any single meeting.
What this means if you hold coins or bullion
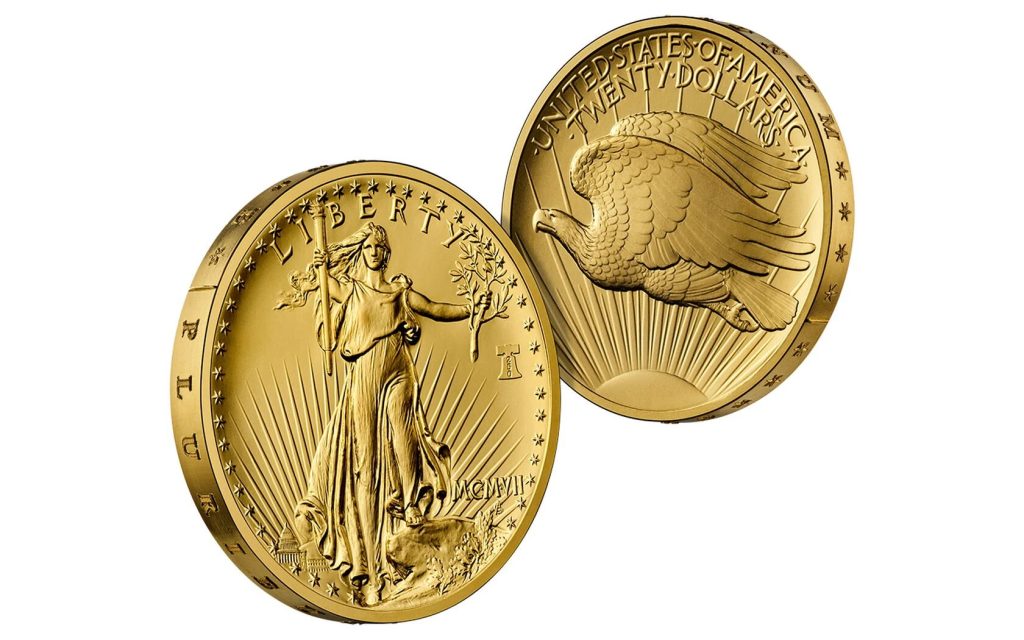
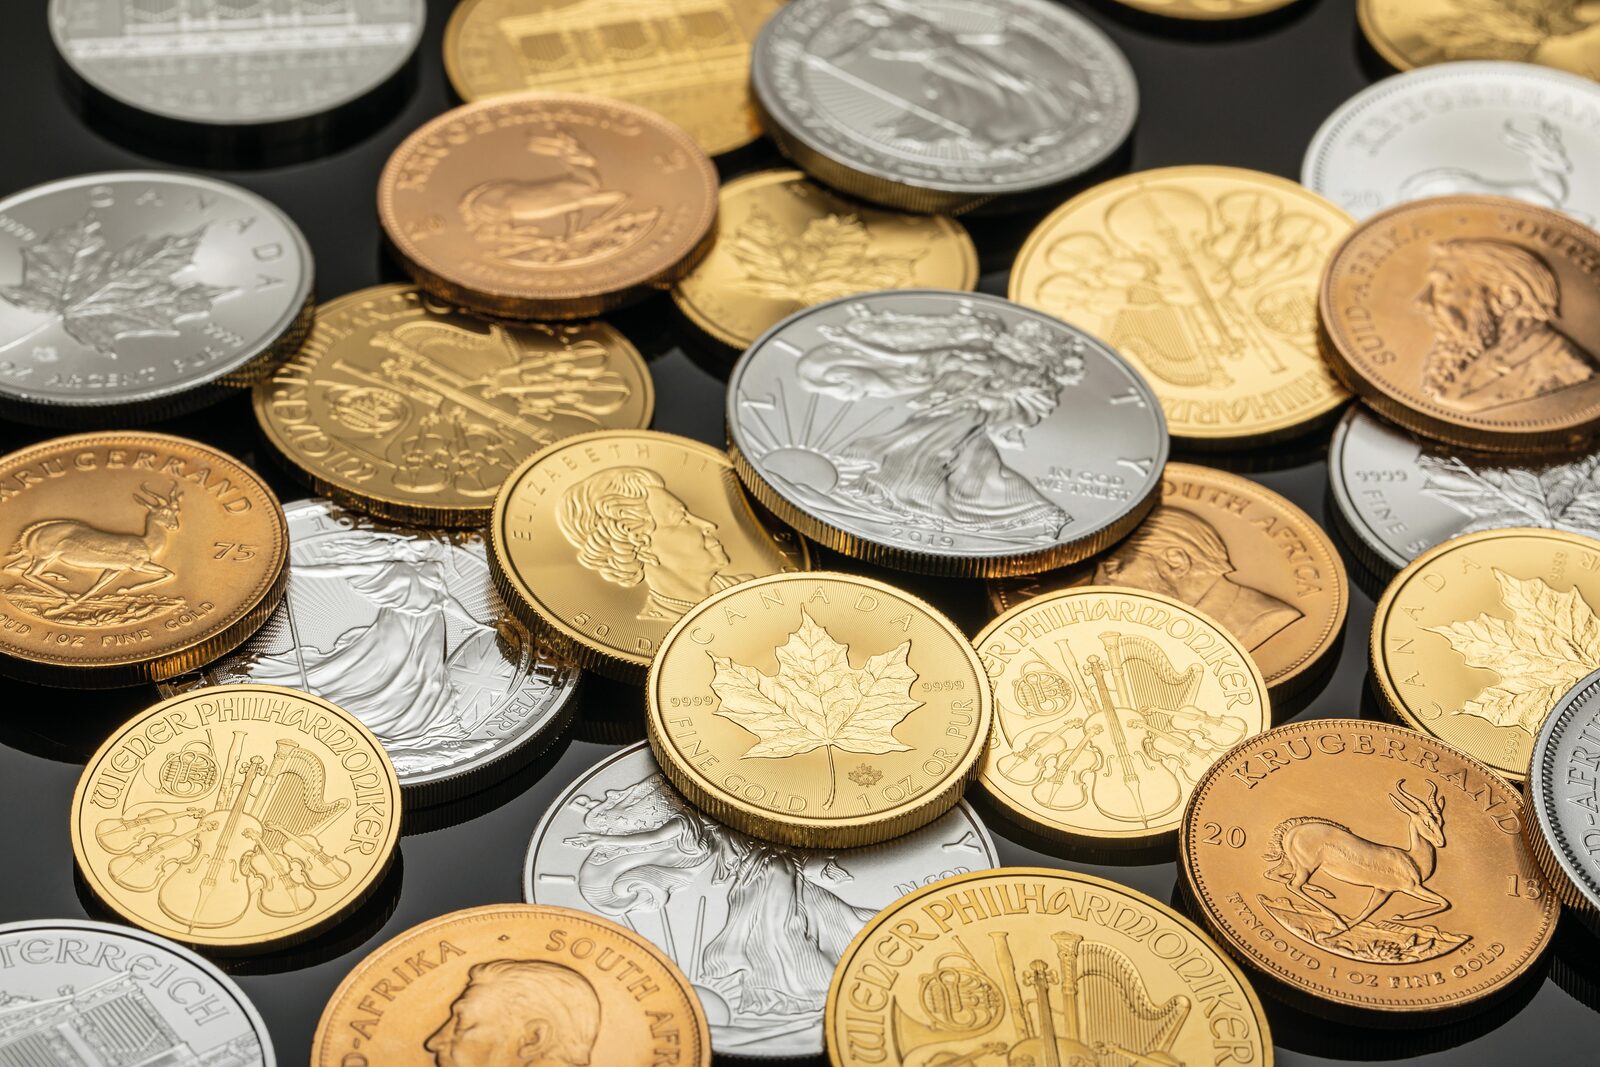
For anyone holding physical metal, the practical translation is short. Spot moved about one percent on the day, which changes the metal value inside a one-ounce bullion coin by about one percent. That is the metal floor, and it is the only part of a coin’s worth that a Fed announcement touches directly. Collector demand, mintage scarcity, grade, and eye appeal do not reprice on a dot plot.
Premiums are a slower-moving matter and tend to respond to physical supply and dealer inventory rather than to policy meetings. A sharp move in either direction can widen spreads temporarily as dealers reprice, which is one more reason that transacting into the teeth of a Fed day rarely improves an outcome. The longer arc of metal prices is set by real yields, the dollar, and central bank buying, and this week nudged only the first of those.
The other drivers have not gone quiet. Inflation prints and dollar strength will keep doing more work than the funds rate on any given week, and the eventual turn toward easing, whenever it comes, has its own well-documented pattern worth understanding in advance: see our look at what gold does when the Fed cuts.
Whatever the committee does in December, the ounce in the safe is the same ounce. Buyers of American Gold Eagles and similar bullion coins have generally been better served by thinking in years than in meetings, and the basic discipline of knowing what you paid over metal has not changed because the federal funds rate moved a quarter point.
None of this is investment advice, and the historical record above describes what happened, not what will.