
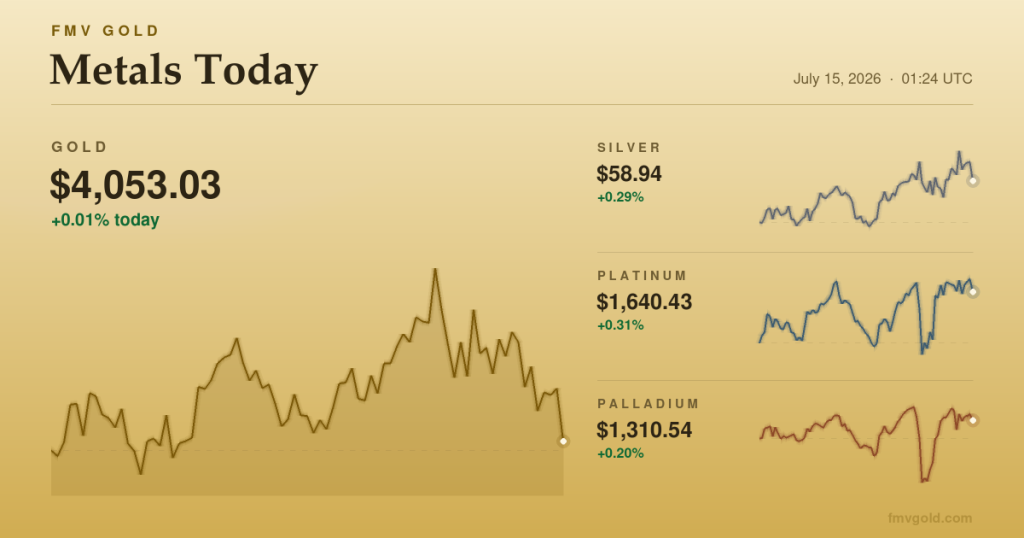
For one hour on Tuesday morning, the metals market had to hold two opposite thoughts at once. At 8:30 New York time, the June inflation report landed friendlier than anyone expected. Barely two hours later, U.S. forces were striking Iranian targets and re-imposing a naval blockade around the Strait of Hormuz. Gold’s answer was a surge to $4,098.92, its high of the day, followed by a long, orderly exhale as stocks rallied into the close. It finished the day up about 1.2%, near $4,050.
The numbers
- Gold +1.2%, closing near $4,050 after touching $4,098.92 (day low $3,986.84)
- Silver +1.8%, touching $59.61
- Platinum +1.6%, peaking near $1,666
- Palladium +3.6%, the day’s leader, reaching $1,325
What happened
The inflation story came first. June’s Consumer Price Index eased to 3.5%, cooler than forecast, and traders promptly pulled back their bets on further rate hikes. Federal Reserve Chairman Kevin Warsh, testifying before Congress the same morning, insisted the central bank has “no tolerance” for persistently elevated inflation, but the market heard the number more than the words. Lower rate expectations tend to support gold, which pays no interest and suffers when cash yields more.
Then came the geopolitics. The U.S.-Iran confrontation escalated sharply: American strikes on Iranian targets, a resumed blockade around Hormuz, and oil back above $80 a barrel. All four metals hit their highs of the day within the same minute, late in the morning U.S. time, as those headlines crossed. It was as clean an illustration of the safe-haven reflex as you will see. The retreat from the highs came amid a powerful stock rally, fueled by blockbuster bank earnings and that friendly CPI print, which drew attention back toward risk assets. President Trump also stepped back from a proposed 20% fee on Hormuz cargo shipments after Gulf allies objected, which may have taken some edge off the supply worry.
What it means for American gold
A 1.2% rise in spot gold lifts the metal value under every gold coin in a collection. For a coin carrying a full troy ounce, such as the American Gold Eagle (United States legal tender at its face value), Tuesday’s move added roughly of metal value. The classic Double Eagle, the design Augustus Saint-Gaudens created at Theodore Roosevelt’s personal urging, carries slightly less gold and gained nearly as much. Silver’s 1.8% day did the same quiet work underneath American Silver Eagles and the Morgan and Peace dollars that once passed hand to hand across the country.
That metal value is a floor, not a price tag. Proof strikes, graded pieces, and pre-1933 gold trade on collector demand and dealer inventory, usually well above their melt. Here is what dealers are paying and charging right now for popular American issues:
| Popular American issues | Metal value | Fair market value |
|---|---|---|
| American Gold Eagle 1/4 oz | $1,065.34 | $1,407.93 |
| American Gold Eagle 1/10 oz | $426.14 | $649.48 |
| American Gold Eagle Proof 4-piece Set (1.85 oz) | $7,883.53 | $11,466.44 |
| Gold Modern Commemorative $10 | $2,061.65 | $2,593.88 |
| Gold Modern Commemorative $5 | $1,030.82 | $1,496.09 |
| American Silver Eagle 1 oz | $62.10 | $93.35 |
| American Silver Eagle Proof 1 oz | $62.10 | $106.53 |
| Silver Modern Commemorative $1 | $48.03 | $68.35 |
| America the Beautiful 5 oz Silver | $310.51 | $536.46 |
| American Silver Eagle Tribute Round 2 oz | $124.20 | $181.13 |
| Kennedy Half Dollar 1964 (90% silver) | $22.36 | $24.86 |
| Franklin Half Dollar (90% silver) | $22.20 | $27.00 |
Metal value is the melt floor at the current spot price. Fair market value is FMV’s live published value for each issue, updated hourly (as of Aug 17, 2026 07:15 UTC). Dealer retail and buyback prices vary around these benchmarks. These figures describe the standard bullion pieces: graded, proof, and rare-date variants in the catalog list above them, sometimes well above, on collectible value.
You can see the live math for any American coin in the catalog; the valuation method itself is spelled out on How It Works.
Where this leaves the market
Even after Tuesday’s pop, gold sits roughly 28% below its all-time high of $5,598.58, set January 29 of this year. It remains down about 7% in 2026 and trades near 10% below its 200-day average. The gold-silver ratio ended the day near 69:1, close to where it has spent the summer. In other words: a strong day inside a market that is still working off a historic peak, not a breakout.
What we’re watching
Whether the Hormuz standoff escalates further or cools, and how Federal Reserve officials talk about the cooler CPI in the days ahead. Oil holding above $80 would keep the tug-of-war alive between inflation relief and safe-haven demand, the same two hands that pulled the market in opposite directions on Tuesday.
Sources
- WSJ: Strong Bank Earnings, Cool Inflation Data Lift U.S. Stocks
- CNBC: U.S. strikes Iran before Hormuz Strait blockade restarts
- NYT: White House Cheers Inflation Data While Iran War Sparks New Price Surge
- Fox Business: Fed Chair Warsh says central bank has ‘no tolerance’ for elevated inflation
Price figures are from FMV Gold’s own minute-by-minute spot archive (UTC trading day).