
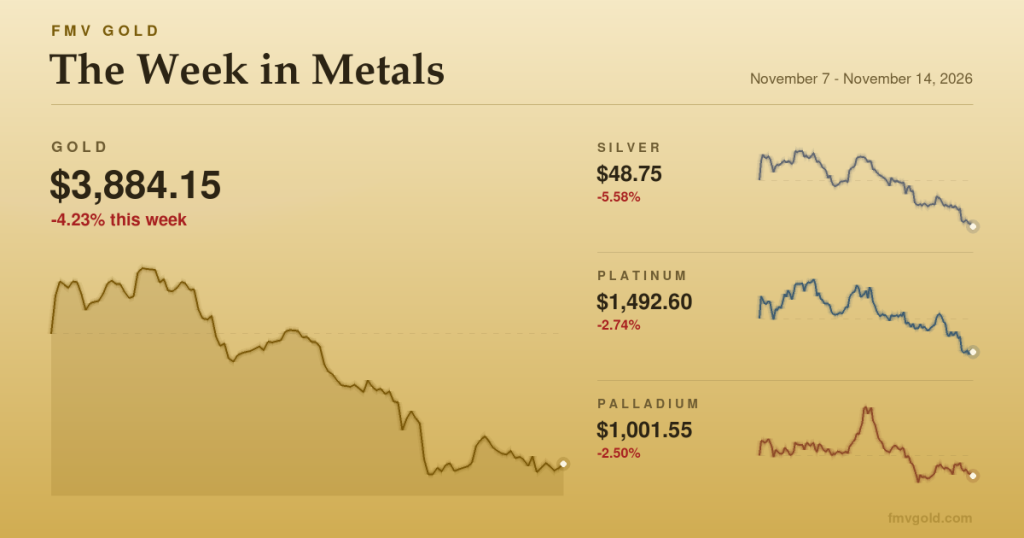
Monday felt like the start of a recovery. Gold climbed above $4,140 on talk of calmer days in the Gulf, silver pushed past $53, and the long autumn slide looked like it might finally be pausing. Then Tuesday’s inflation report landed, the bond market went back to work after Veterans Day, and the rest of the week belonged to the rate-hike crowd. By Friday’s close gold had given back more than $186 an ounce and settled at $3,884.15, while silver finished at its lowest daily close in a year.
The week in numbers
- Gold: down 4.58% on the week, from $4,070.59 to $3,884.15. High $4,145.86 (Monday, Nov. 9); low $3,853.23 (Thursday, Nov. 12).
- Silver: down 6.14%, from $51.94 to $48.75. High $53.65 (Monday, Nov. 9); low $48.49 (Friday, Nov. 13).
- Platinum: down 3.02%, from $1,539.05 to $1,492.60. High $1,585.76 (Tuesday, Nov. 10); low $1,488.86 (Friday, Nov. 13).
- Palladium: down 2.18%, from $1,023.90 to $1,001.55. High $1,091.07 (Wednesday, Nov. 11); low $989.29 (Thursday, Nov. 12).
Moves run from the prior Friday’s close to this Friday’s close; highs and lows are intraweek, UTC.
The stories that moved the market
The week opened on a softer note in the oil patch. President Trump said further U.S. strikes on Iran were highly unlikely while talks continued, crude eased, and the dollar slipped, all of which gave gold room to run. It was a hopeful start, though not a carefree one. The prior Friday’s jobs report had shown 165,000 October payrolls against expectations near 65,000, and futures were already leaning toward a quarter-point Federal Reserve hike at the Dec. 8 and 9 meeting.
Tuesday changed the mood. October consumer prices rose 0.4% for the month against a 0.3% forecast, with core prices up 0.3% where economists had looked for 0.2%. (There was no annual figure this time, because prices were not collected in October 2025 during the government shutdown.) Gold fell back toward $4,040 that day. The Treasury market was closed Wednesday for Veterans Day, so the full repricing waited a day, and metals drifted in the meantime.
When bonds reopened Thursday, they did so with a vengeance. The 10-year Treasury yield pushed above 5.1%, the dollar touched a 19-month high, and rate futures priced roughly a 9-in-10 chance of a December hike, with a small but real chance of a half-point move. Gold dropped about 3% in the session to its lowest level in more than a year. Silver slipped back under $50.
Friday brought a modest reprieve. October producer prices came in at 0.3% against a 0.4% forecast, and hike odds eased a few points. Gold bounced off its lows on bargain hunting but couldn’t hold much of it; Tai Wong, an independent metals trader in New York, observed that the metal may struggle to retake $4,000 with Fed hawks out in force. Reuters had gold on course for its worst week since early June. Silver, which had held up better midweek, gave up its footing late Friday and closed near the week’s low.
What it means for American gold
For anyone holding American Gold Eagles, the metal inside each one-ounce coin is worth roughly $186 less than it was a week ago, on spot alone. That figure is metal value only. It’s the floor under the coin, and it moved because spot moved.
The one-ounce American Silver Eagle lost a little over $3 of metal value over the same stretch, a larger slice in percentage terms than gold. Older silver dollars such as the Morgan and Peace carry less than an ounce of silver apiece, so their melt floor moved proportionally less in dollars, though in the same direction.
Pre-1933 gold, including the Saint-Gaudens double eagle, followed the same arithmetic at the metal level. Augustus Saint-Gaudens designed that coin at Theodore Roosevelt’s urging, and collectors have been paying for the artistry ever since. That’s the point worth remembering in a week like this: proof, graded, and commemorative premiums move on collector demand, and they tend to move more slowly than spot. A sharp week for the metal is not automatically a sharp week for a scarce coin. Our valuation method explains how we separate the two.
Where this leaves the market
Gold now sits about 28% below its record daily close of $5,414.49, set on Jan. 28, 2026. It is down about 10% for the year, a deficit that widened from roughly 6% a week ago. Spot finished about 12.5% below its 200-day average of $4,440.30, and the average itself is drifting lower, down about $22 over the week.
Silver’s picture is starker. It closed about 58% below its Jan. 28 record of $116.61 and is down nearly 32% year to date, compared with about 27% a week earlier. Its 200-day average stands near $68.10. Silver underperformed gold this week, so the gold-silver ratio widened to about 79.7 from 78.4, meaning an ounce of gold now buys nearly 80 ounces of silver. The live picture is on our market charts.
The week ahead
- Monday, Nov. 16: Fed Chairman Kevin Warsh gives opening remarks at a San Francisco Fed conference on productivity and jobs.
- Tuesday, Nov. 17: Fed Governor Christopher Waller speaks on payments in New York.
- Wednesday, Nov. 18: Minutes of the Oct. 27 and 28 FOMC meeting are released at 2 p.m. Eastern. After this week, traders will read them closely for any hint about December.
- Friday, Nov. 20: Fed Governor Lisa Cook speaks on the U.S. economy in a global context, in Santiago, Chile.
The December decision itself comes at the Dec. 8 and 9 meeting.
Sources
- Kitco: Gold, silver rise as Iran diplomacy pressures crude, dollar weakens (Nov. 9)
- US consumer prices rise 0.4% in October, above forecasts, as core inflation holds at 0.3%
- Kitco: Gold, silver slide as Treasury yields surge, Fed hike concerns intensify (Nov. 12)
- USAGOLD: Gold tumbles 3% as dollar hits 19-month high on Fed hike bets; silver slides under $50
- Reuters via Kitco: Rate hike bets keep gold on track for its worst week in four months (Nov. 13)
- Federal Reserve: November 2026 calendar
Price figures are from FMV Gold’s own minute-by-minute spot archive (UTC trading days).