
Gold closed Friday, September 25, at $4,284.91 an ounce. That is a fine price by any standard that existed two years ago, and it is also roughly 23% below the $5,589.38 the metal touched intraday on January 28. Both facts are true at once, which is why the same question keeps arriving in two tones of voice. Is the bull market finished, or has nothing much happened?
The honest answer starts with arithmetic rather than opinion. A decline of that size is neither trivial nor unprecedented, and measured against gold’s own past it is close to ordinary. What follows is what gold price correction history actually contains, with the figures attached.
Why the price rolled over this year
The proximate cause is not mysterious. On September 16 the Federal Reserve raised its target range for the federal funds rate by a quarter point, to 3.75% to 4.00%, in a unanimous vote. It was the first increase since 2023. Chair Kevin Warsh has been blunt that inflation is, in his words, too high and has been for too long, and officials signaled that another increase this year is possible. Gold had already fallen about 3% in a single session on August 28, after Warsh indicated more action could be needed.
Gold pays no coupon. When cash and Treasuries pay more, the cost of holding an ounce instead goes up, and the price usually reflects it. We have gone through that machinery in our pieces on real interest rates and on what a rate hike has historically meant for gold. This is a recognizable cause producing a recognizable effect, not a break in how the market works.
What gold price correction history actually shows
The World Gold Council keeps a tally of gold’s declines from record highs going back to 1971, when the dollar came off its last formal link to the metal. Their mid-year 2026 accounting counts eight episodes in which gold fell more than 20% after setting a record. The average of those eight was a 36% drawdown. The median was 29%. Their summary line is worth remembering: drawdowns tend to stabilize around 30% from the previous peak.
Shallower dips are far more common. The same work counts 29 declines of 5% or more since 1971, averaging 16% with a median of 8%, and 11 declines of 10% or more, averaging 30%. Read the tiers together and a pattern appears: gold slips 5% constantly, gives back 20% or more about once a market generation, and when it does, roughly 30% is where the bleeding has usually stopped.
At 23% below January’s high, the current decline sits inside that distribution rather than outside it. It is deeper than the median 20%-plus episode and shallower than the average one.
Four declines worth knowing by name
1974 to 1976: down about 47%
Americans often remember the 1970s as one long unbroken run in gold. Technically it was two runs with a serious bear market in the middle. From roughly $195 at the end of 1974, gold fell to around $100 by the middle of 1976, a decline near 47% that took about two years. The causes were prosaic: improving economic conditions, official efforts to demonetize gold, and IMF auctions adding supply. Gold then went from that $100 area to $850 by January 1980.
1980 to 1999: down about 70% over 19 years
This is the one that should give any confident forecaster pause. Gold peaked at $850 on January 21, 1980, was near $300 by 1982, spent the rest of the decade well below its high, and finally bottomed close to $250 in 1999, a low the market still calls the Brown Bottom. That nominal record stood for nearly 28 years and was not exceeded until 2008. Real rates were high, inflation was cooling, central banks were selling rather than buying, and mine supply was rising. Conditions can stay hostile for a very long time.
2008: down about 30% in seven months
Gold peaked near $1,011 to $1,033 in March 2008 and traded near $692 to $700 by October, a fall of roughly a third, in the middle of a crisis it supposedly protects against. The reason is instructive. Institutions facing margin calls sold what was liquid and profitable in order to raise dollars, and gold qualified on both counts. The dollar spiked, gold fell, and the two moved together for months. Only after the Fed began buying assets did the picture reverse, a sequence we traced in our look at quantitative easing and gold prices. Gold made new records by 2011.
2011 to 2015: down about 45% over four years
From $1,921 on September 6, 2011, gold ground lower for four years to roughly $1,045 in December 2015. The worst came in a rush. Gold broke below $1,535 on Friday, April 12, 2013, sank through $1,400 the following Monday, and posted its biggest single-day loss since 1983. By late June the price had lost about 25% in three months, nearly half of it in those two April sessions.
The measuring stick changes the answer
Here is a wrinkle that trips up a lot of comparisons. Whether a decline reads as 43% or 47% often depends on whether you measure from daily extremes or from monthly averages. One widely cited version of the bear market history, built on monthly averages, counts five bear markets since 1971 and puts them at 43% for 1974 to 1976, 52% for 1980 to 1982, 57% for 1983 to 1985, 48% for 1987 to 1999, and 42% for 2011 to 2015. Those are the same events described above, sized differently.
The 2026 numbers carry the same footnote. Spot gold’s intraday record was $5,589.38 on January 28, while the London PM fix, the benchmark many institutions settle against, peaked near $5,405 the following day. Measured from the fix, today’s decline is slightly smaller. Neither figure is wrong, and it pays to know which one a chart uses.
What the record does not tell you
Gold price correction history is a distribution of outcomes, not a schedule. Averages are the most misleading part of it, because the recoveries vary enormously. The 2008 decline was fully repaired within about two years and led to new highs. The 1980 high took nearly three decades to clear in nominal terms. An average of the two describes neither.
Nor is any of this a timing signal. Knowing that drawdowns have historically stabilized near 30% does not tell you this one will stop there, or when the turn comes. The World Gold Council’s own mid-year view was that gold might trade within about 5% of $4,100 in the second half of this year, which the market has so far bracketed rather than obeyed. Central bank buying, which has averaged roughly 1,000 tonnes a year since 2022, is one of the few demand pillars that has not wobbled, and we cover that steady official appetite in our piece on central banks and precious metals. Whether it holds is a forecast, and forecasts are not history.
What holders tend to do with this information
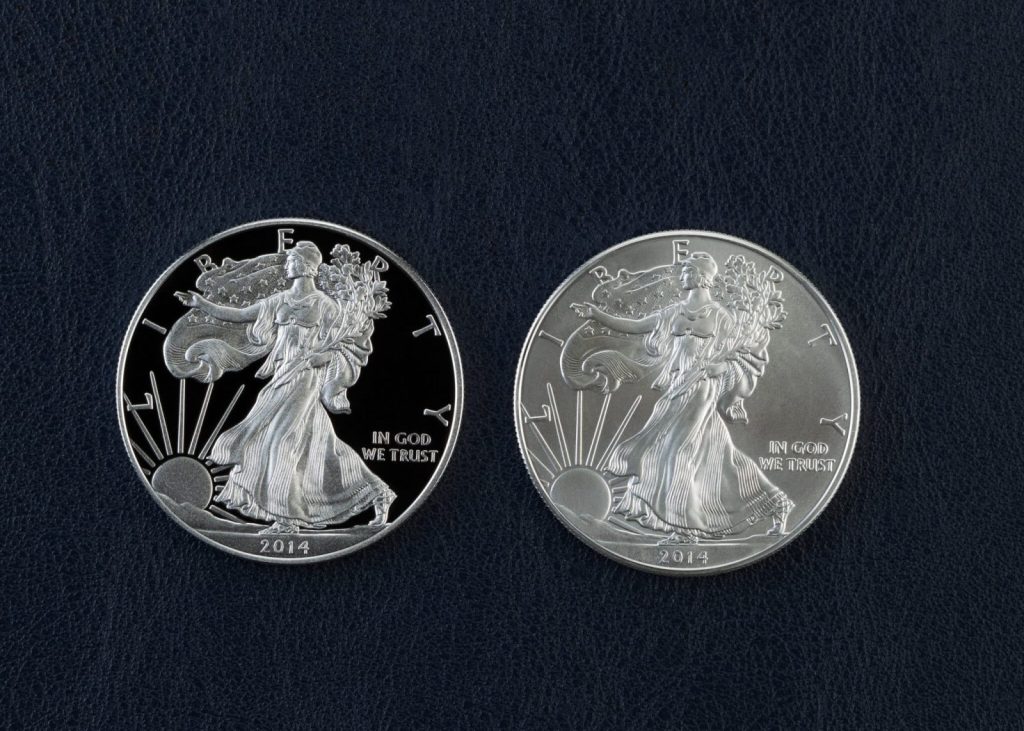
A drawdown reaches a bullion holder and a collector differently. For plain one ounce bullion, metal value tracks spot almost exactly, so a 23% move in spot is a 23% move in the metal value. For graded, proof, commemorative, and pre-1933 material, the collector premium is a separate layer that does not move in lockstep with the metal and has historically been stickier in both directions. Our explanation of how valuation works covers that split, and the live market page shows where spot sits today.
The habits that survive a correction are dull ones: know what you paid in ounces rather than dollars, keep records current, and decide in advance what would change your mind. Our rules of gold page lays out the principles we keep returning to, and the American Gold Eagle listings show how one ounce bullion issues are catalogued.
None of this is a recommendation to buy or sell anything. It is context. Gold has fallen more than 20% from a record eight times in 55 years and has still spent that span going from $35 an ounce to four figures. Both halves of that sentence belong to the same story, and a holder who understands only one of them will be surprised eventually.