

The week in numbers
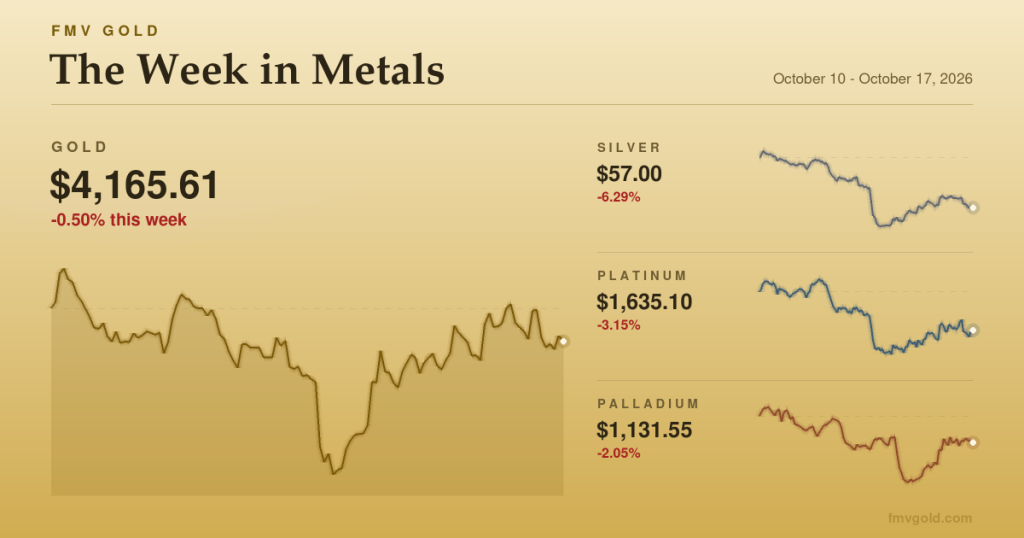
Spot gold closed the session on June 16 around $4,330 per troy ounce, essentially unchanged on the day and only marginally higher than where it began the week. That flat headline masks an unusually violent path. After opening the week near $4,330, gold sold off hard, printing an intraweek low near $4,070 on June 10 before clawing back almost the entire decline over the following four sessions. Peak-to-trough, the metal swung roughly 6–8% inside a single week — a wide range for an asset often described as a store of stability.
Silver was the more dramatic story. It fell from around $69 to an intraweek low near $61.50 — a drawdown in the low double digits — before rebounding to close near $70, leaving it modestly higher on the week. That pattern is characteristic: silver tends to fall faster and bounce harder than gold, a function of its thinner, more leveraged market. (More on that dynamic in the companion piece on gold versus silver.)
Among the other precious metals, platinum held near $1,810 and palladium near $1,355, both quieter than the monetary metals. The gold-to-silver ratio — the number of silver ounces it takes to buy one ounce of gold — sat in the low 60s, up from the mid-50s in May, reflecting silver’s deeper spring correction.
For perspective on scale: gold remains roughly a fifth to a quarter below its all-time high near $5,590 set in late January 2026, while silver trades well below its own January record above $120. The current move is best understood as volatility within a historically elevated price regime, not a return to pre-2025 levels.
What drove the move
Three threads converged.
Repriced Fed expectations. The dominant driver was a hawkish shift in interest-rate expectations. A stronger-than-expected May employment report — payroll growth came in at more than double the consensus estimate — undercut the case for near-term rate cuts. Futures markets moved to price overwhelming odds that the Federal Reserve holds its policy rate in the 3.50–3.75% range, and at least one major bank pushed its expected easing into 2027. Because gold pays no income, the opportunity cost of holding it rises when bond yields stay elevated and cuts recede. That repricing was the proximate cause of the mid-week selloff.
An inflation-and-energy crosscurrent. Cutting the other way, an energy-driven inflation impulse tied to Middle East tensions kept a floor under the metals. Higher inflation is, on its face, supportive for gold as a hedge — but it is double-edged here, because the same impulse is part of what is keeping the Fed cautious about cutting. The net effect was a market pulled in two directions, which is one reason the recovery was as fast as the decline.
The dollar and yields. A firmer U.S. dollar accompanied the hawkish repricing. Gold is priced in dollars, so a stronger dollar mechanically raises its cost for overseas buyers and tends to weigh on price. As the dollar’s surge faded into the back half of the week, gold found its footing.
Under the surface: positioning, flows, and official demand
Day-to-day prices are set at the margin, and three flows matter most.
Futures positioning. Much of bullion’s short-term volatility originates in the futures market, where speculative traders use leverage to express views. When a crowded long position meets a hawkish surprise, the resulting unwind — traders selling to cut exposure — can amplify a move well beyond what the news alone would justify. The speed of this week’s washout and rebound has the fingerprints of positioning-driven flows rather than a fundamental reassessment.
ETF flows. Physically-backed exchange-traded funds (ETFs) — funds that hold bullion on behalf of shareholders — act as a slower, more durable signal of investor demand. Sustained inflows add a persistent bid; outflows do the opposite. Around sharp corrections, ETF holdings often reveal whether longer-horizon investors are using weakness to add exposure or stepping back, and they typically move with a lag to price.
Central bank activity. The official sector has been a structural pillar of demand through this cycle. Central bank buying does not trade tick-by-tick, but persistent official accumulation has been widely credited with cushioning corrections and supporting the elevated price floor that defines the current regime. (The dedicated central-bank article examines this in depth.)
Why this matters for investors
This week is a useful case study in how gold actually behaves, as opposed to how it is often marketed. Three takeaways stand out.
First, “safe haven” does not mean “low volatility.” Gold can deliver equity-like swings over short windows, particularly when the dominant driver is interest-rate repricing rather than a flight to safety. Investors who hold bullion for diversification should expect — and size for — meaningful drawdowns along the way.
Second, the driver matters more than the direction. Gold sold off this week not on a single piece of “bad news” but on a shift in the rate outlook. Understanding why a move is happening — rates, dollar, inflation, geopolitics, or positioning — is more useful than the price change itself, because different drivers carry different staying power.
Third, round-trips are common. A 6–8% intraweek swing that nets out near flat is a reminder that reacting to single sessions is hazardous. The longer-term thesis for holding gold — diversification, monetary hedging, official-sector demand — operates on a horizon measured in years, not days.
What investors should watch next
- The FOMC decision (June 16–17). The single most important near-term catalyst. Markets broadly expect no change to the policy rate; the swing factor is the tone — the updated projections and the Chair’s characterization of the inflation-versus-jobs trade-off. A hawkish hold could revive the selloff; any softening of the higher-for-longer message could extend the rebound.
- Incoming inflation and labor data. With the rate path now data-dependent, each inflation print and jobs report carries outsized weight for the metals.
- The dollar and real yields. Watch the direction of the U.S. dollar and inflation-adjusted (real) bond yields; these remain gold’s most reliable macro tethers.
- ETF holdings and positioning reports. Whether this week’s recovery is confirmed by fund inflows and a healthier futures positioning backdrop will help distinguish a durable low from a dead-cat bounce.
This article is informational market analysis and scenario discussion, not investment advice. Prices cited are approximate spot levels as of June 16, 2026 and move continuously.
More from this series · FMV Gold News & Analysis
- Gold and the Macro Machine: How Rates, Inflation, and the Dollar Set the Tone
- Two Metals, Two Jobs: Why Gold and Silver Play Different Roles in a Portfolio
- The Official Bid: How Central Banks Shape the Gold Market
- Five Ways to Own Gold — and What Each One Actually Gets You
- When the Hedge Gets Tested: Tail Risks in the Gold Market
- The Slow Forces: How ESG, Technology, and Mining Supply Will Shape Gold for Decades