
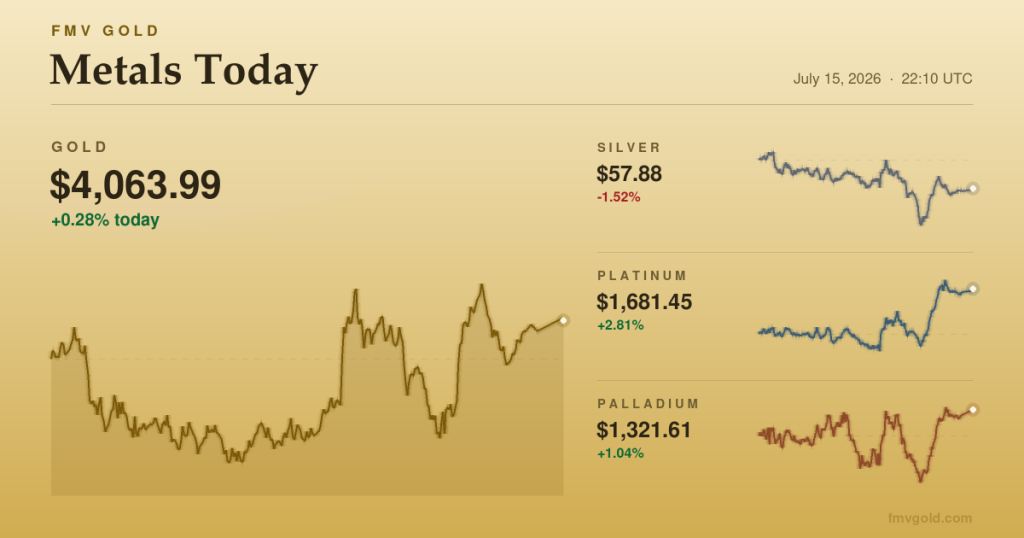
Platinum ran away with the session. While gold ground out a small gain and silver quietly gave back ground, the white metal climbed close to 3% and finished the American trading day near $1,681. It made for a split tape: the two headline metals leaning opposite ways while the platinum-group names did the heavy lifting.
Underneath the noise, the day carried two threads that have been pulling at this market for weeks. A softer inflation reading has traders rethinking how far the Federal Reserve will go, and a flare-up around the Strait of Hormuz has put a fresh geopolitical bid under hard assets. Neither settled anything today. Both left fingerprints.
The numbers
- Gold firmed about 0.3%, opening near $4,053, tagging roughly $4,079 at its intraday high, and closing around $4,064.
- Silver slipped about 1.5%, ranging from a high near $59.06 down to $56.67 before settling near $57.88.
- Platinum jumped roughly 2.8%, reaching about $1,691 and closing near $1,681, the standout of the four.
- Palladium added about 1%, touching roughly $1,323 and finishing near $1,322.
What happened
The move came amid Tuesday’s cooler inflation print, which showed consumer prices up 3.5% over the year through June, down from 4.2% the month before, with the core measure flat on the month. Traders read that as reason to pare back bets on further Fed tightening ahead of the July 28-29 policy meeting. Fed Chair Kevin Warsh, testifying before Congress this week, kept the 2% target front and center, and the market was left to guess how patient the committee intends to be.
A softer dollar, off around half a percent on the day, tends to travel alongside firmer metal prices, and it did again here. At the same time, a fourth day of U.S. strikes on Iranian positions kept oil bid and nerves frayed, the sort of backdrop that historically draws buyers toward gold and, this time, toward platinum and palladium as well. Silver was the odd one out, easing back even as the rest of the complex firmed, a reminder that the gray metal often trades to its own rhythm.
None of this is a tidy cause-and-effect story. Prices moved amid the news, not provably because of it, and the coming Fed meeting looms large enough that a single day’s tape should be read with care.
What it means for American gold
A steady day like Wednesday moves the metal floor only modestly: a one-ounce coin such as the American Gold Eagle picked up about of metal value as gold held above ,060, while silver’s small slip took a few dimes off the melt underneath Silver Eagles and the old Morgan and Peace dollars. Platinum’s day at the front of the pack was the exception in an otherwise quiet tape.
Melt is the floor, not the market: proof, graded, and pre-1933 pieces trade on collector demand, usually well above their metal. Here is what dealers are paying and charging right now for popular American issues:
| Popular American issues | Metal value | Fair market value |
|---|---|---|
| American Gold Eagle 1/4 oz | $1,065.34 | $1,398.59 |
| American Gold Eagle 1/10 oz | $426.14 | $645.17 |
| American Gold Eagle Proof 4-piece Set (1.85 oz) | $7,883.53 | $11,390.35 |
| Gold Modern Commemorative $10 | $2,061.65 | $2,576.67 |
| Gold Modern Commemorative $5 | $1,030.82 | $1,486.16 |
| American Silver Eagle 1 oz | $62.10 | $92.26 |
| American Silver Eagle Proof 1 oz | $62.10 | $106.53 |
| Silver Modern Commemorative $1 | $48.03 | $67.38 |
| America the Beautiful 5 oz Silver | $310.51 | $528.83 |
| American Silver Eagle Tribute Round 2 oz | $124.20 | $178.62 |
| Kennedy Half Dollar 1964 (90% silver) | $22.36 | $24.86 |
| Franklin Half Dollar (90% silver) | $22.20 | $26.62 |
Metal value is the melt floor at the current spot price. Fair market value is FMV’s live published value for each issue, updated hourly (as of Aug 11, 2026 23:01 UTC). Dealer retail and buyback prices vary around these benchmarks. These figures describe the standard bullion pieces: graded, proof, and rare-date variants in the catalog list above them, sometimes well above, on collectible value.
Any coin’s live value is in the catalog; the method behind it is on How It Works.
Where this leaves the market
Step back and the day looks small against the longer arc. Gold sits roughly 23% below its all-time high in our archive and about 10% under its 200-day average, and it remains down some 7% for the year to date. Silver is the heavier story, off about a fifth in 2026 and running roughly 18% below its own 200-day mark. The gold-silver ratio finished near 70, meaning it takes about 70 ounces of silver to match one of gold, a level that sits comfortably in its long-run middle rather than at any extreme.
What we’re watching
The July 28-29 Fed meeting is the next fixed point, and every data release between now and then, from jobless claims to the next inflation update, will be weighed against it. The Strait of Hormuz thread stays live and unpredictable, capable of moving oil and the metals on any headline. We will keep translating those moves into what they mean for the coins in American hands.
Sources
- Gold Rally Above $4,060 as Inflation Data Fuels Fed Policy Shift Bets (IndexBox)
- Gold prices today, Wednesday, July 15, 2026 (Yahoo Finance)
- Gold set for first weekly rise in a month as investors scale back Fed rate-hike bets (CNBC)
- Precious Metals News: Gold, Silver, PGMs as Investors Brace for Fed Meeting (INN)
Price figures are from FMV Gold’s own minute-by-minute spot archive (UTC trading day).