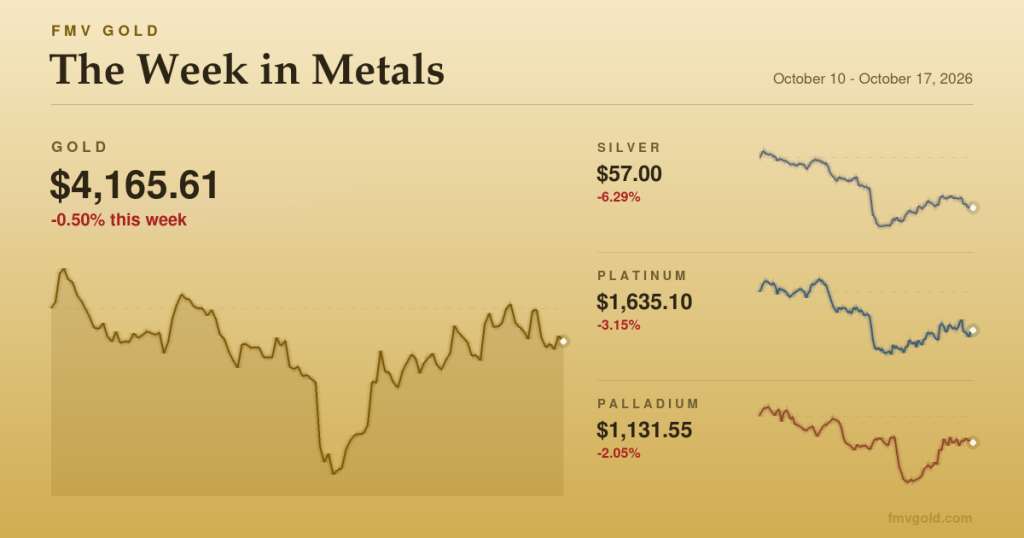

Spot silver sat near $61 an ounce as October opened, with gold near $4,177. Those are the numbers on the screen, and they are the ones most buyers watch. They are not the numbers that decide what a one-ounce coin costs above its metal value, and they are not where a tight physical market shows up first. The earliest signal comes from a corner of the London wholesale market that almost no retail buyer looks at: the rent on borrowed metal.
Understanding that rent will not tell you where the price is going. It will tell you, usually weeks before your dealer’s ask page changes, whether the physical market is comfortable or strained.
What silver lease rates actually are
Big users of silver do not always buy it. A refiner with a production run scheduled for next month, an industrial fabricator with an order book, a bank squaring a position: all of them may prefer to borrow metal, use it, and return metal later. Central banks and large holders lend. Bullion banks intermediate. The annualized rent on that loan is the lease rate.
It is a derived number rather than a posted one. The identity is simple arithmetic: the lease rate equals the dollar interest rate minus the forward rate at which the market will swap metal for dollars. The World Gold Council states it plainly in its guidance on deposit rates, where the derived lease rate is Libor minus the gold forward offered rate. Swap metal for dollars cheaply and the implied rent is low. Make the market pay dearly for that swap and the rent climbs.
Transparency here is thinner than you might expect. The London Bullion Market Association published forward rates from 1989 until it stopped on January 30, 2015. Since then the quotes circulate privately among market participants and reach the public only through commentary and trade reporting. That is part of why these moves surprise retail buyers: there is no public tape to watch.
The resting level matters for calibration. Silver’s lease rate historically sat below 1% a year, low enough that nobody outside the trade ever mentioned it.
Why silver lease rates ever reach 39 percent
In October 2025 they did exactly that. On October 9, with the London noon benchmark fixing at $49.64 and spot spiking to $51.24, finally clearing the January 18, 1980 record of $49.44, the one-month borrowing cost in London ran near 19% a year after nearly tripling in a session. At the squeeze’s peak that month the one-month rate reached roughly 39%, among the highest ever recorded. Bruce Ikemizu of the Japan Bullion Market Association summed up the mood in four words: “This is serious.”
The cause was not a shortage of silver in London. It was a shortage of available silver. Roughly 83% of the metal in London’s vaults sat inside physically backed exchange traded products, pledged to shareholders and not for rent. That left something like 136 million ounces genuinely free to trade and lend, a record reported low at the end of September 2025. London’s over-the-counter turnover averaged around 450 million ounces a day that year. A free float smaller than a third of one day’s trading is not a cushion, it is a tripwire.
Silver lease rates are the price of that tripwire being touched. They rise because the metal you want to borrow is already promised to someone else.
EFP: the spread that shows where the metal is wanted
The second gauge is the exchange for physical, or EFP, the mechanism that lets a holder of a Comex futures position swap it for London metal. The spread between the two venues is the price of that swap, and in calm conditions it is small and boring.
During 2025 it was neither, and it told two different stories in the same year. Tariff uncertainty pulled metal westward into American warehouses for months, leaving Comex futures trading above London for much of the year. By that October, with the stress now concentrated in London, the relationship inverted and New York futures traded at a discount to London spot. The sign of the EFP is a map: it shows which vault the market is short of, and metal moves toward the premium until the gap closes.
How wholesale stress becomes a coin premium
None of the above is a coin price, and that is the point worth carrying home. A coin’s premium pays for fabrication, packaging, distribution, and the dealer’s risk in holding inventory. When borrowed metal is expensive and the float is thin, blanks get scarce, fabrication queues lengthen, mints ration allocations, and wholesalers raise their asks. A retail dealer who sells a coin today has to replace it tomorrow at whatever the replacement costs, so the ask follows the replacement cost upward.
Something less obvious happens on the other side of the counter. In a genuine shortage the fastest available supply is metal already in private hands, so bids for common, instantly recognizable coins can firm at the same time. The spread between the two is the real cost of a round trip, which we covered in detail in the bid-ask spread on gold and silver. Premium behavior through the historical episodes is laid out in why premiums spike during shortages, and the mechanical link to the metal price in why coin premiums change when gold and silver move.
Watch the sequence and you can see why premiums sometimes move while spot does not. Borrowing costs rise, wholesale queues stretch, retail asks widen, and the quoted spot price may barely budge through all of it. Two prices, two sets of causes.
Where things stand as October 2026 opens
Current conditions sit somewhere between the 2025 panic and the old calm. Three-month silver was lending at about 2.3% a year in late September 2026, a small fraction of the October 2025 peak but still several times the pre-2025 norm. The structural problem has not resolved: roughly 83% of London’s silver remains locked inside investment products, with that same thin free float underneath. The 2025 calendar year closed with a fifth consecutive annual deficit in the silver market.
Price has done its own violent round trip. Silver reached an all-time high of $121.67 in January 2026, fell hard through the spring, and trades near $61 now, roughly half the peak. A buyer looking only at that chart would conclude the physical market had gone slack. The borrowing cost says it has loosened without returning to normal, which is a different statement. Live spot levels sit on our market page.
Using the gauge without overreading it
Silver lease rates and the EFP are weather instruments, not forecasts. An elevated rate tells you metal is hard to borrow this month. It says nothing reliable about where the price goes next, and anyone presenting it as a timing signal has made a leap the data does not support.
What it does support is practical. In a tight window, expect wider asks and slower delivery on fabricated products, and compare total delivered cost per ounce rather than headline premium, the discipline described in how our pricing works. Widely traded sovereign bullion such as the American Silver Eagle tends to show the clearest premium response because it is the most actively replaced. For a holder thinking about selling, the same conditions that widen asks are often the conditions that firm bids, which is a better reason to pay attention than any price target. Browse the full catalog of graded and bullion coins if you want to compare families.
The durable lesson is one of our oldest: metal value is the floor and the premium is the weather above it, a principle laid out in the rules of gold. Your retail quote is the final link in a chain that begins with an unglamorous rent payment in a London vault, and the rent is usually the first thing to move.