
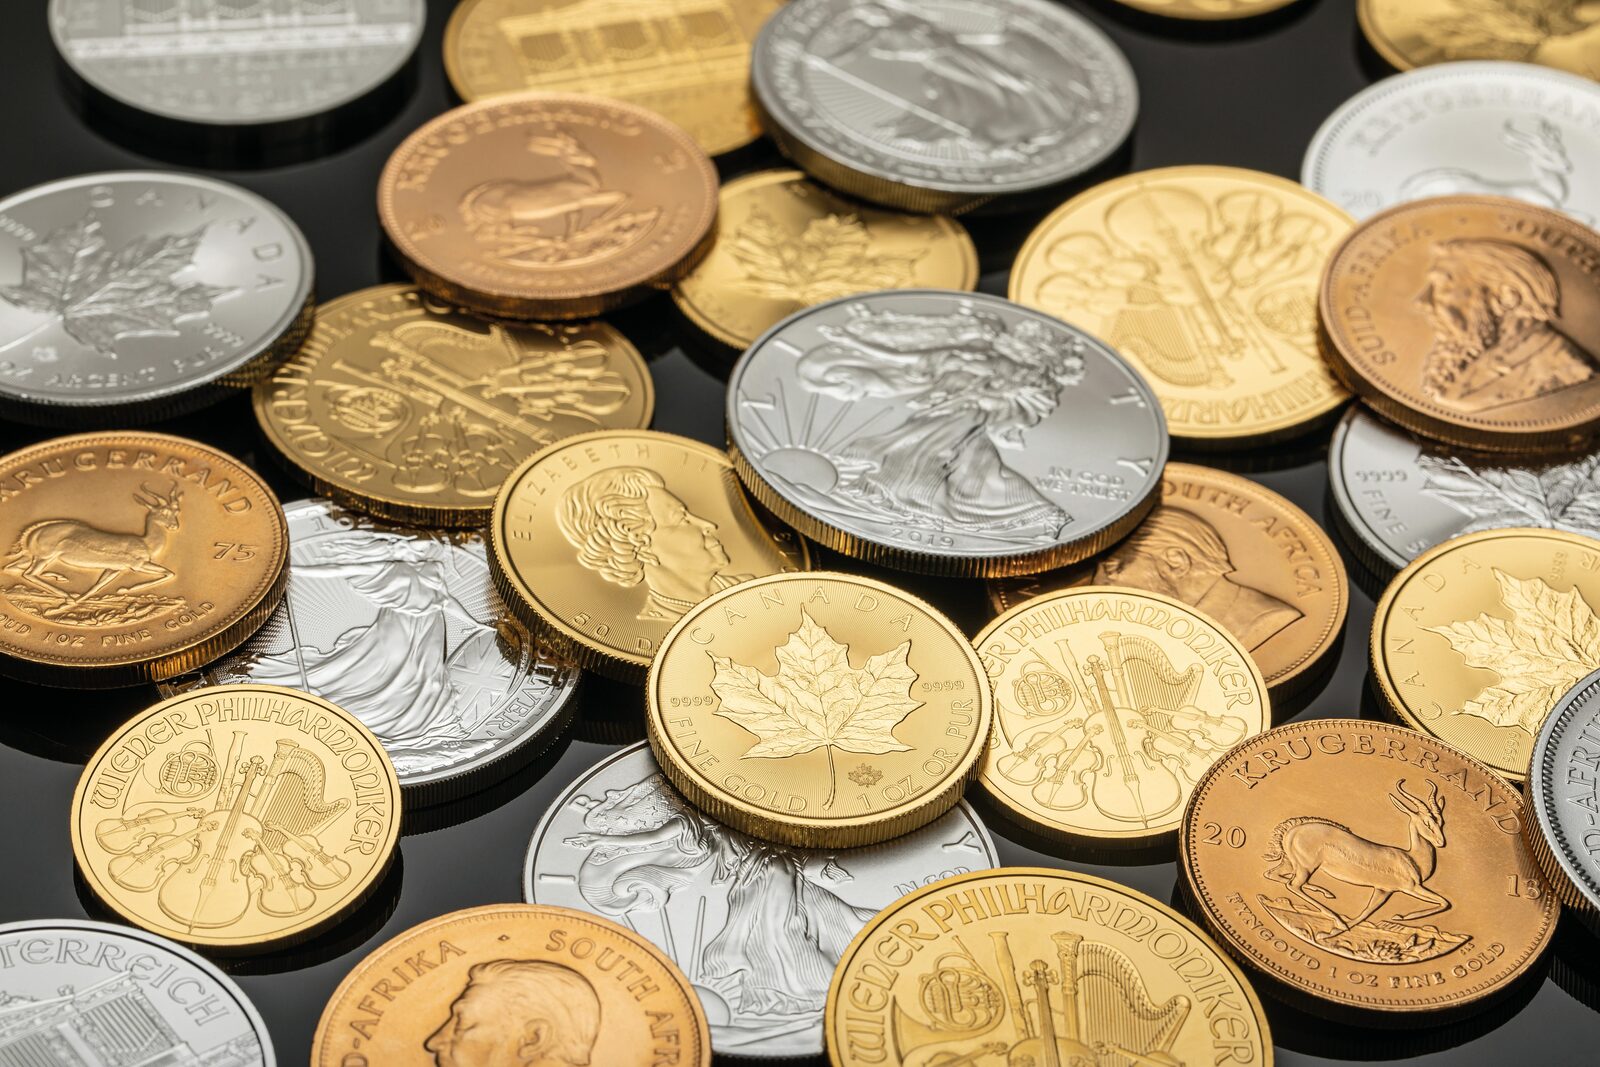
Ask a room of coin collectors whether gold goes up in a recession and most hands will rise. It’s one of the oldest beliefs in the hobby, and it has a decent record behind it. It also has a few ugly exceptions that tend to get left out of the retelling, and those exceptions are exactly what a holder needs to understand before the next downturn arrives.
So here is the record, recession by recession, using the official dates and a couple of independent tallies. The goal isn’t to predict the next one. It’s to know what gold has actually done when the economy shrank, so the next time headlines turn grim you’re reacting to history rather than to folklore.
Does gold go up in a recession? The short answer
Usually, but not reliably, and rarely in a straight line. The United States has had seven recessions since 1973, as dated by the National Bureau of Economic Research (NBER), the private research group that serves as the country’s official referee on business cycles. Gold finished higher across most of them. It also fell sharply during two, went nowhere during another, and in the two worst financial panics of the period it dropped hard before it rallied.
Schroders, the British asset manager, looked at all seven using a window running from six months before each recession began to six months after it ended. On that measure, gold returned an average of 28% and beat the S&P 500 by 37 percentage points. That’s a strong showing. But an average across seven very different episodes hides a lot, so it’s worth walking through them.
Seven recessions, one at a time
The figures below are the change in gold’s nominal price over each NBER recession window, as compiled by Visual Capitalist from Macrotrends data, with the S&P 500 alongside for comparison. Different studies pick different start and end points, so you’ll see other numbers quoted elsewhere. The direction is what matters.
- November 1973 to March 1975: gold up about 87%, stocks down about 13%. This was the oil-embargo recession, with inflation running hot and the dollar newly cut loose from gold. Gold’s best showing by far.
- January to July 1980: gold down about 5%, stocks up about 7%. Gold had already peaked at $850 in January 1980, right as the recession began, after a speculative run.
- July 1981 to November 1982: gold roughly flat (up under 2%), stocks up about 6%. Paul Volcker’s Federal Reserve had pushed rates to extraordinary levels to break inflation, and a non-yielding metal struggled to compete.
- July 1990 to March 1991: gold essentially unchanged, stocks up about 5%.
- March to November 2001: gold up about 5%, stocks down about 2%. A quiet recession and a quiet result, though it came near the start of gold’s long climb out of the 1990s.
- December 2007 to June 2009: gold up about 16%, stocks down about 37%. The global financial crisis, and the period most people have in mind when they call gold a safe haven.
- February to April 2020: gold up about 6%, stocks down about 1% over a recession that lasted just two months.
Count them up and gold beat stocks in four of seven recessions. The four were the inflationary 1970s episode, the 2001 slowdown, the 2008 crisis, and the pandemic. In 1980, 1981 and 1990, it lagged.
Why the results split
The pattern makes more sense once you stop thinking about recessions and start thinking about what the Fed and interest rates were doing at the time. Gold pays no interest, so its appeal rises and falls with what you give up by holding it. Our piece on real interest rates and gold covers that mechanism in detail.
In 1981, the Fed was deliberately causing a recession with very high rates to kill inflation. Real yields were steep, and gold had just come off a bubble top. Schroders points to exactly that combination: a high starting price plus Volcker-era tightening. In 1973, 2008 and 2020, by contrast, policy turned very loose. Schroders notes gold’s performance was “most explosive” in those episodes, when the official response was especially accommodative. Rate cuts, money creation and falling real yields lifted gold more than the recession itself did. If you want the longer version of that story, see does gold go up when the Fed cuts rates.
Starting price matters too. A recession that begins right after a speculative surge, like 1980, has less room for gold to run.
The part people forget: gold can fall first
The 2008 and 2020 results look comfortable on a table. Living through them was a different experience.
Gold broke $1,000 an ounce for the first time in early 2008. Then, as the financial system buckled that autumn, it fell to around $692 in the wake of the Lehman Brothers collapse, a decline of roughly one-third from peak to trough. Investors and funds facing losses sold whatever they could, and gold was liquid, so it went out the door with everything else. It did recover, setting new highs above $1,200 in 2009, but anyone who needed cash in October 2008 sold near the low.
March 2020 rhymed. In the week ending March 13, gold futures lost 9.3%, their worst week since 2011, as investors raced to cash and Treasury bills. Gold then recovered and went on to new records above $2,000 that summer.
The lesson is that gold has tended to behave as a recession hedge over the full cycle, but in the acute panic phase it can trade as a source of cash. That’s worth keeping in mind if your metal is also your emergency fund. Our look at gold price correction history shows how routine drops of that size have been.
You won’t know it’s a recession until later
One practical wrinkle: recessions are dated after the fact. NBER announced on December 1, 2008 that the downturn had started in December 2007, nearly a year earlier. By the time a recession is official, gold has often already moved. Waiting for the announcement before buying has historically meant buying after a good part of the rally, and selling into a panic has meant selling into the dip.
That’s one reason many long-term holders treat gold as a standing allocation rather than a trade timed to the economy. A few principles we keep coming back to are collected in our rules of gold.
Where that leaves a coin or bullion holder today
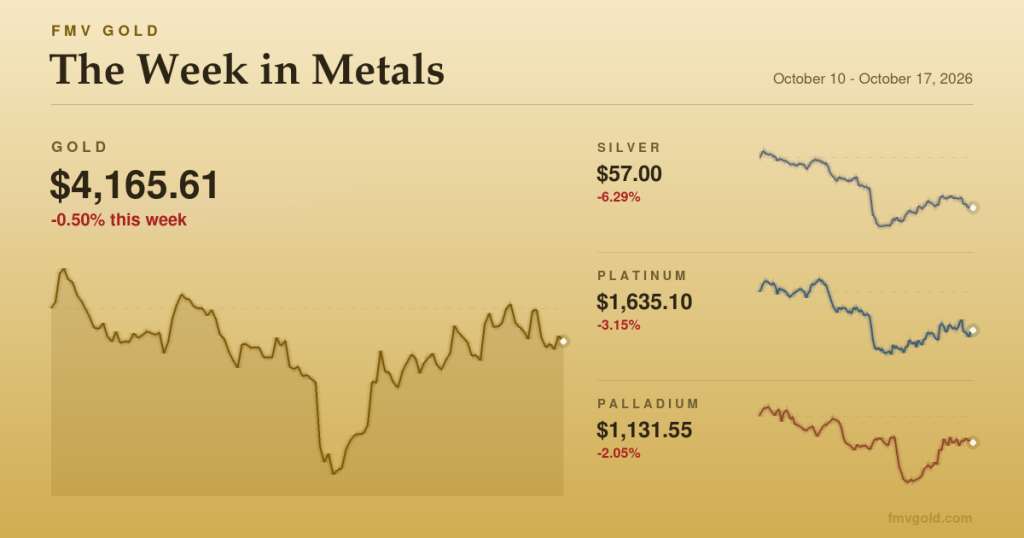
Gold enters this autumn far higher than in any of those earlier recessions. Spot was around $4,120 an ounce on the morning of October 20, 2026, about 5.5% below where it stood a month earlier, according to Fortune’s daily price tracker. Nobody has declared a recession, and this article isn’t a forecast that one is coming. You can follow the daily moves on our markets page.
For a plain one-ounce bullion coin like the American Gold Eagle, the metal value moves with spot, so a 30% drawdown like 2008’s would cut its melt value by roughly the same share while it lasted. Collector coins are a separate matter: proof, graded and pre-1933 pieces trade on collector demand above melt, and that demand has its own rhythm in hard times. If you want to see how we track metal value against market value, here’s how it works.
The honest summary of seven recessions is this. Gold has more often than not held its value or gained when the economy contracted, especially when the response was easy money. It has lagged when the Fed was squeezing inflation, and it has sometimes dropped hard in the first weeks of a panic. Owning it for the full cycle has worked better than trying to catch the turn. None of this is investment advice. It is simply what the record shows, warts included.