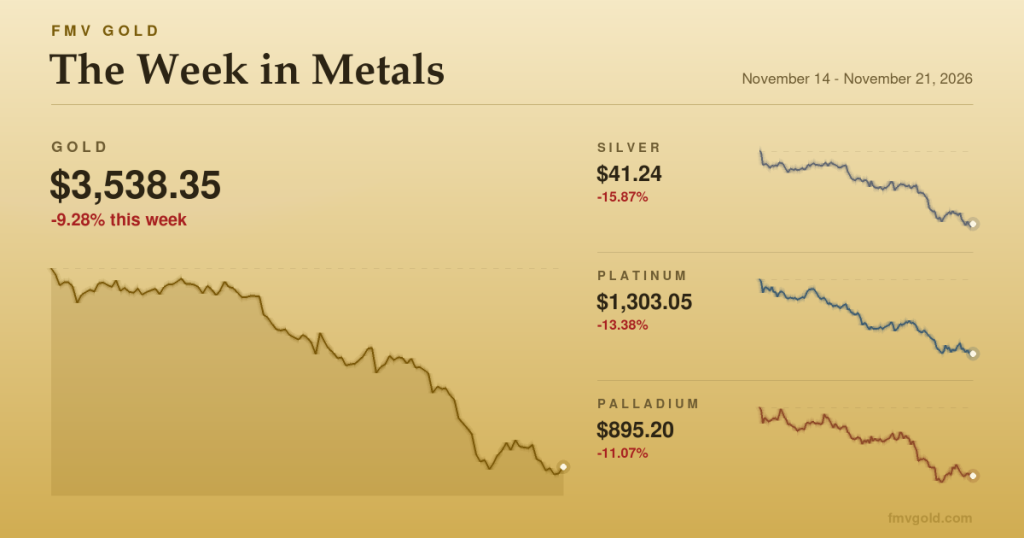

If you own a Gold Eagle or a tube of Silver Eagles, the last two months have been hard to watch. Gold spot traded around $3,550 an ounce late last week, its lowest level since September 2025. That’s roughly 36 percent below the record near $5,589 set on January 28. The week ending November 20 was gold’s worst since March, with a loss of about 8 percent, and silver fell even harder to the low $40s.
So why is gold going down, and so quickly? The short answer is that the market is now asking how far, and how fast, the Federal Reserve will raise rates. The longer answer is worth knowing, because it tells you what to watch next and why this selloff looks different from a loss of faith in gold itself.
Why is gold going down right now?
Three forces are pushing in the same direction at once, and they feed each other.
The Fed has turned hawkish. Minutes of the October Federal Open Market Committee meeting, released November 18, showed that the Fed held rates steady in October but that “the vast majority” of officials saw upside risks to inflation. Since then the tone from individual officials has hardened. Governor Christopher Waller has said a half-point increase could be necessary, and Philadelphia Fed President Anna Paulson has signaled that further tightening may be warranted. By Friday, CME FedWatch put the odds of at least a quarter-point hike at the December 8-9 meeting at about 99 percent.
Bond yields have climbed past 5 percent. The 10-year Treasury yield has been trading above 5 percent, levels last seen in 2007. Inflation data has kept the pressure on: October producer prices were up 6.5 percent from a year earlier, the largest annual rise since late 2022.
The dollar has firmed. The U.S. Dollar Index has been trading near its strongest levels of the year. Because gold is priced in dollars worldwide, a stronger dollar makes each ounce more expensive for buyers in Mumbai, Shanghai, or Zurich and tends to pull the dollar price down.
The mechanism: gold pays no interest
None of this is new in principle. Gold doesn’t pay a coupon or a dividend. When a Treasury bond yields 2 percent, holding gold costs you very little in income you could have earned elsewhere. When the same bond yields 5 percent, and inflation-adjusted yields rise along with it, the cost of sitting in a non-yielding metal goes up. Some investors, especially the large funds that trade gold futures and ETFs, sell.
We’ve written about this link in detail in our explainer on real interest rates and gold, and about the dollar’s role in how the dollar affects the price of gold. What’s unusual about November 2026 is that both levers are moving against gold at the same time, and the move is happening fast. Markets react to surprises, not levels, and open talk of a half-point hike from a sitting Fed governor counts as one.
Why the fall has been so steep
A 36 percent decline is large by any standard. Part of the reason is simple arithmetic: gold ran a very long way up before January’s peak, and a lot of that rally was built on expectations of lower rates and a weaker dollar. When those expectations reverse, the positioning built on them unwinds.
Leverage adds to it. Futures traders who bought on margin get margin calls when prices drop, and forced selling begets more selling. That’s why gold’s down days lately have tended to come in clusters, and why silver, a smaller and more volatile market, has fallen harder still.
History offers some perspective here, though not a forecast. Gold has gone through deep corrections before, including multi-year declines after its 1980 and 2011 peaks. Our piece on gold price correction history walks through how deep and how often those drawdowns have run. And our earlier look at what a Fed rate hike means for gold covers how past tightening cycles played out. The record is mixed. Gold has sometimes fallen ahead of a hiking cycle and then recovered once the hikes actually began, because the bad news was already in the price.
What the selloff hasn’t changed
It’s worth separating the price from the demand underneath it. The World Gold Council reported that central banks added 321 tonnes of gold in the third quarter of 2026, up about 42 percent from a year earlier. That buying, which we cover in our explainer on central banks and gold, is driven by reserve diversification and is generally slow to react to short-term rate moves. Reports this week also pointed to stronger physical buying in India and China as prices fell, a familiar pattern when price-sensitive buyers in those markets see a discount.
That doesn’t mean those buyers will stop the decline. Central banks and jewelry buyers move tonnes; futures markets move far more paper ounces in a day. But it does mean the current selloff is mostly a rates-and-dollar story, not evidence that the structural buyers have walked away.
What this means if you hold physical gold
For a plain 1-ounce bullion coin, the metal value has dropped by roughly $2,000 from the January high. That’s the floor, the value of the gold inside the coin, and it moves with spot every trading day. Coins with collector demand, such as proofs, graded pieces, and pre-1933 gold, carry premiums above that floor that don’t necessarily move one-for-one with spot.
A few practical observations, offered as context and not as advice:
- Fast markets tend to widen dealer spreads. If you’re buying or selling during a volatile week, compare the buy and sell sides rather than just the headline premium.
- Your cost basis is what you paid, not the record price. A holder who bought in 2023 or 2024 is in a very different position from one who bought at the January top.
- Most people hold physical gold for long-horizon reasons: insurance against currency debasement, financial stress, or simply a store of value outside the banking system. Whether a December rate hike changes those reasons is a question only you can answer.
You can follow spot moves on our live markets page, and if you want to see how the metal value of a specific coin is calculated, how FMV Gold works explains the method. For the most widely held U.S. gold coin, our American Gold Eagle catalog shows how its metal content tracks spot.
What to watch next
The December 8-9 FOMC meeting is the obvious date on the calendar. A quarter-point hike is almost fully priced in, so the bigger question for gold is what the Fed signals about 2027. A half-point move or language suggesting several more hikes would likely keep pressure on. A hike paired with hints that the Fed is close to done could do the opposite, which is how “sell the rumor, buy the news” episodes have played out before.
Beyond the Fed, the next CPI and producer-price reports, the path of the 10-year yield around 5 percent, and the dollar index will tell you more about gold’s direction in the near term than any headline about demand. Central-bank buying is the slower current underneath; the next World Gold Council quarterly report will show whether it held up through the drop.
Gold has been through sharp repricings before, and it has also surprised people who declared it finished. For now, the honest read is that gold is going down because money now has a real price again, and the market is adjusting to it.