
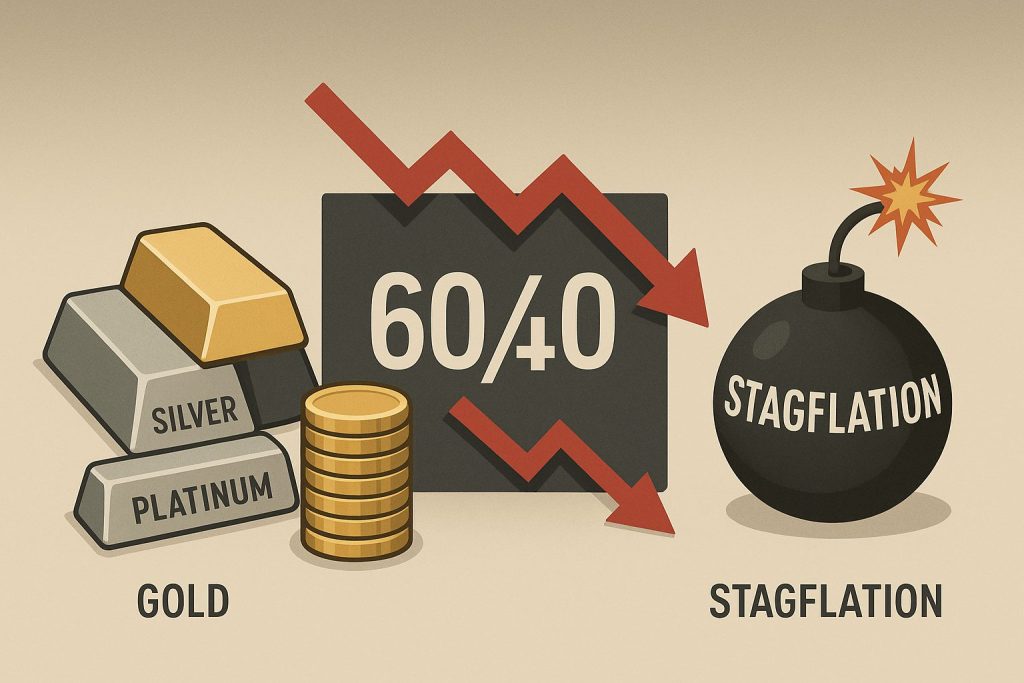
Stagflation is the economic combination nobody plans for: prices keep rising while growth stalls and jobs get harder to find. It sounds like a textbook curiosity until you remember that the United States lived inside it for most of the 1970s. Whenever inflation runs hot and the economy looks tired at the same time, the same question lands in our inbox: does gold do well during stagflation? The record gives a clearer answer than most macro questions do, but it also comes with a catch worth understanding before you lean on it.
What stagflation actually means
The word blends “stagnation” and “inflation.” Economists don’t share one official definition, so it helps to see how a serious study pins it down. The World Gold Council, in an October 2021 research note, counted any quarter in which inflation was accelerating and growth was decelerating on a year-over-year basis as stagflationary. It measured growth with the Conference Board’s Leading Economic Index and inflation with U.S. core CPI. By that yardstick, stagflation showed up in 68 of 201 quarters, and the longest stretch lasted eight quarters.
That definition is broader than the popular image of gas lines and double-digit inflation. It catches milder episodes too, which matters when you read the results.
The 1970s: the case everyone cites
The modern gold market was born at the start of the stagflation era. Under the Bretton Woods system, the dollar was tied to gold at $35 an ounce. In the summer of 1971 President Nixon stopped exchanging dollars for gold with foreign central banks, and the metal began to trade on its own.
Then came the shocks. An Arab oil embargo declared on October 19, 1973 nearly quadrupled the price of oil, from $2.90 a barrel to $11.65 by January 1974, according to the Federal Reserve’s own history. By 1974, the Fed’s account notes, inflation was over 12 percent and unemployment was above 7 percent. That is stagflation in its purest form.
Gold responded. Using London annual averages, the metal averaged about $58 an ounce in 1972 and $159 in 1974. It did not go straight up, though. After the first shock faded, gold gave back a big piece of its gains, and the 1976 average fell to about $125, down roughly 22 percent from the prior year. Anyone who bought at the 1974 enthusiasm waited years to feel vindicated.
The second act was larger. The Iranian revolution in 1979 tripled the cost of oil again. Paul Volcker took over the Fed in August 1979 with inflation above 11 percent. Gold’s annual average climbed to about $307 in 1979, and on January 21, 1980 it touched its famous $850 peak. By the summer of 1980, the Fed’s history records inflation near 14.5 percent and unemployment above 7.5 percent.
How the 1970s story ended
This is the part that gets left out of the sales pitch. Volcker’s Fed tightened hard, and the federal funds rate hit a record 20 percent. Two recessions followed, with unemployment peaking at 10.8 percent in late 1982. Inflation broke, falling to 3.7 percent by 1983.
Once inflation was beaten and real interest rates turned sharply positive, gold lost its tailwind. The annual average slid from about $615 in 1980 to roughly $376 in 1982 and to a decade low near $317 in 1985. Stagflation lifted gold; the cure for stagflation knocked it back down. If you hold metal as protection against a stagflationary spell, it’s worth knowing that the protection tends to fade when policymakers finally win.
Does gold do well during stagflation across the whole record?
The World Gold Council’s study looked at every regime from the first quarter of 1973 through the second quarter of 2021. In stagflationary quarters, gold priced in dollars posted an annualized average adjusted return of 32.2 percent, the best of the assets it measured. The S&P 500 averaged a loss of 6.6 percent in the same quarters, and international stocks (MSCI EAFE) lost 11.6 percent. Treasuries and corporate bonds were positive but well behind gold.
The Council was candid about the obvious weakness: the 1970s “probably have an outsized impact” on the full-period numbers. So it also ran the last 20 years on their own. Gold still came out ahead in stagflationary quarters, at 14.7 percent annualized, while the S&P 500 averaged a loss of 5.6 percent. The edge shrank, but it did not disappear.
A fair reading, then: across five decades, gold has tended to hold up better than stocks when inflation is accelerating and growth is slowing. Note the word “tended.” These are averages over many quarters, not a promise about the next one.
2022: a warning about rates and the dollar
If inflation alone drove gold, 2022 should have been a banner year. Inflation ran far above the Fed’s target, growth slowed, and recession talk was everywhere. Gold finished the year at about $1,814, a gain of just 0.4 percent according to World Gold Council figures.
The Council’s explanation is the most useful lesson in this whole article. Gold faced “much higher opportunity costs,” it wrote, from steadily rising interest rates and the strongest U.S. dollar in 20 years. Its model of real rates and the dollar suggested gold “should have fallen by more than 30%” that year. Inflation and geopolitics kept the metal roughly flat instead of sharply lower. Long-term inflation expectations also stayed anchored because bond investors believed the Fed would do whatever it took.
Put the 1970s and 2022 side by side and a pattern emerges. Gold shines in stagflation when real interest rates are low or falling and confidence in the policy response is shaky. When the central bank is raising rates aggressively and the dollar is strong, gold’s stagflation advantage can be largely cancelled out. We’ve covered the mechanics in more depth in our pieces on real interest rates and gold and how the dollar affects the price of gold.
What this means for a coin and bullion holder
A few practical takeaways, with the usual reminder that none of this is investment advice.
- Watch real rates, not just the CPI headline. Inflation numbers grab attention, but the gap between interest rates and inflation has mattered more for gold. Our guide to how CPI reports move gold explains why a hot print can sometimes hurt.
- Expect a bumpy ride. Even in the best stagflation run on record, gold dropped hard between 1974 and 1976 before its larger move.
- Know the exit risk. The 1980s showed that a determined central bank can end stagflation and gold’s run together.
- Stagflation is not the same as recession. Plain downturns without rising inflation have a different record, which we walk through in does gold go up in a recession.
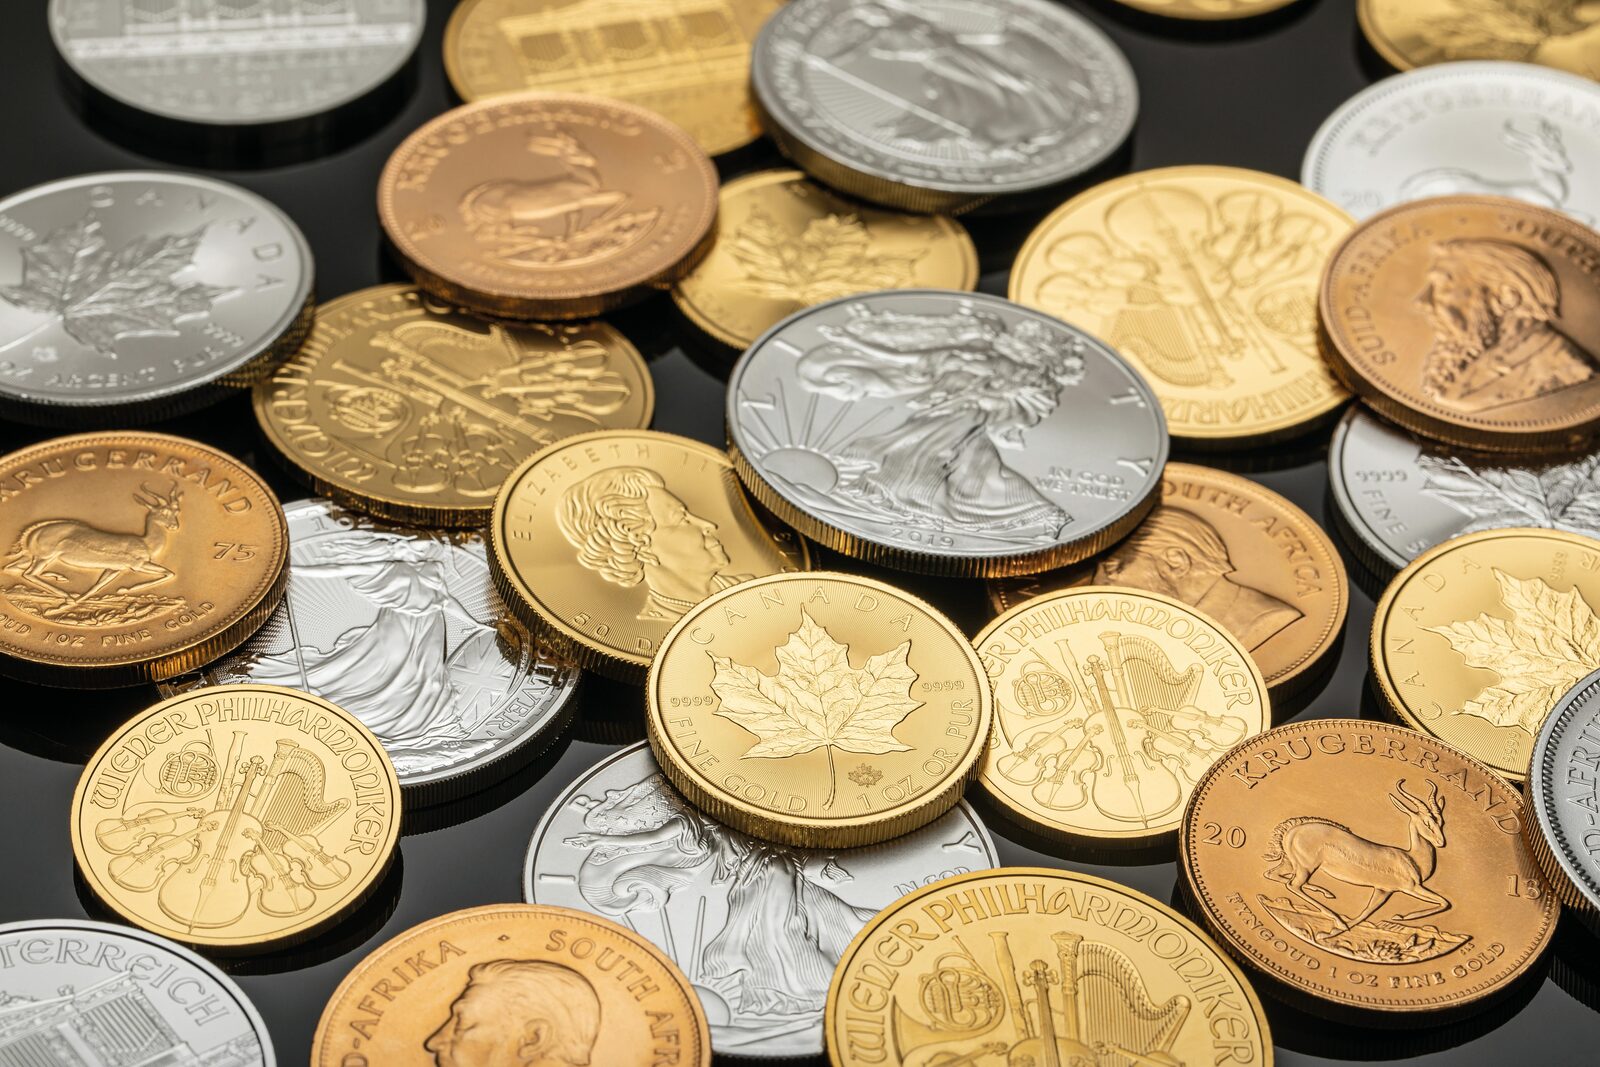
For bullion holders, remember what your coins actually track. A plain one-ounce American Gold Eagle carries a full ounce of gold, so its metal value moves with spot. As of November 6, 2026, gold was trading around $4,040 an ounce, down about 2 percent from the day before. Melt value is the floor under a coin, not its market price, and collector coins trade on their own demand. Our rules of gold page and how FMV Gold works explain how we separate the two, and you can follow spot on our markets page.
The bottom line
Does gold do well during stagflation? Historically, yes, more often than not, and by a wider margin than stocks. The 1970s made the case, and two decades of more recent data kept it intact in milder form. But 2022 is a reminder that gold doesn’t respond to inflation in isolation. It responds to what inflation does to real interest rates and the dollar, and to how much faith people have that the problem will be fixed. Stagflation helps gold most when that faith is in short supply.